Automatically extracting bomb drops from the Blitz Bomb Census maps
GIS
Python
I am curious because I was thinking that a timeline map would give a visual effect of the huge destruction and hard times the Londoners had to go through…so I googled for it and found the following:
- a nice research blog which uses the Blitz Bomb Census from The National Archives
-
a blog entry from the Guardian about the first day - and data - of the Blitz over London.
Here the source of info is the London Metropolitan Archives
Anyway I experimented with the little map from the first blog and wrote a little program using SimpleCV.
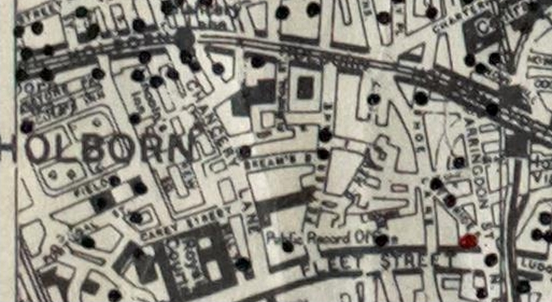
This is were I started from:
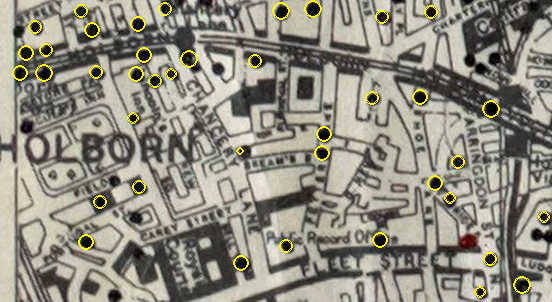
The code is quite simple and the parameters could be changed to get higher accuracy.
blz = Image("./sampleimages/the_blitz.png")
img = blz.copy()
dist = img.colorDistance(SimpleCV.Color.WHITE)
dist.dilate(2)

segmented = dist.stretch(240, 255)
blobs = segmented.findBlobs()
if blobs:
 circles = blobs.filter([b.isCircle(0.6) for b in blobs])
 for c in circles:
  img.drawCircle((c.x, c.y),
                 c.radius(),
                 SimpleCV.Color.YELLOW,
                 2)
 img.show()
Reuse
Citation
BibTeX citation:
@online{spinielli2012,
  author = {Spinielli, Enrico},
  title = {Automatically Extracting Bomb Drops from the {Blitz} {Bomb}
    {Census} Maps},
  date = {2012-05-19},
  url = {https://enrico.spinielli.net/posts/2012-05-19-automatically-extracting-bomb-drops},
  langid = {en}
}
For attribution, please cite this work as:
Spinielli, Enrico. 2012. “Automatically Extracting Bomb Drops from
the Blitz Bomb Census Maps.” May 19, 2012. https://enrico.spinielli.net/posts/2012-05-19-automatically-extracting-bomb-drops.